Time Space Diagrams Revisited
Widely used in the design and analysis of transportation systems, time-space diagrams were developed in an era of data scarcity, when it was necessary to obtain data by means of driver logs, human observers or aerial photographs. In this paper we show how time-space diagrams still remain relevant today, in an era of data abundance.
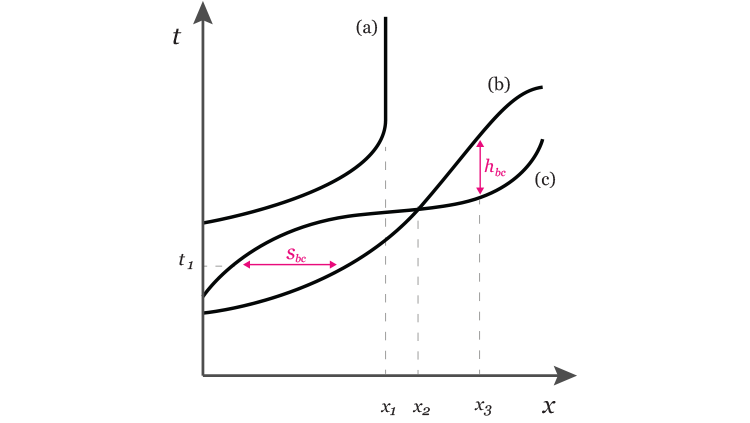
We present an application that efficiently encodes the trajectories of bus GPS data in a time-space cube and uses simple geometric methods to calculate and visualize the headways and separation of buses on a bus route. We discuss these methods in detail and explore how they can be used as the basis of a software package to monitor performance measures for a variety of applications.
Finally, we demo a visualization and analysis tool that can allow transit operators and regulators to better understand network performance and behavior.
Joint work with Zeng Wei (NTU) and Stefan Muller Arisona (ETH Zurich).
A Anwar, W Zeng, S. Müller Arisona: The Time-Space Diagram Revisited. Transportation Research Board 93rd Annual Meeting 2014, Jan 6 – 10, Washington DC, USA (paper, poster)
A Anwar, W Zeng, S. Müller Arisona: The Time-Space Diagram Revisited. Transportation Research Record, Vol 2442, Urban and Traffic Data Systems, Vol. 1 (paper)